North Carolina’s highways are among the deadliest in the U.S. and yet bills are continually proposed in the North Carolina legislature to raise the speed limit from 70 to 75 miles per hour on highways statewide. In my opinion, if these bills became law, it would lead to even more tragic deaths on our highways.
North Carolina is typically among the top 10 states with the most traffic deaths. In 2021, there were 1,783 people killed in traffic crashes on North Carolina roads, with 427 people dying due to excessive speed.
While supporters say that there are several benefits to raising the speed limit in North Carolina, like improving the economy, there’s strong evidence that increasing the speed limit will lead to more deaths.
Would Raising the Speed Limit Improve the Economy?
The economic benefits are overstated. Supporters tend to point to one study that found that raising the speed limit could have a limited beneficial economic impact. For example, commercial trucks might get to their destinations a bit more quickly.
However, the same study also found that the increased operating costs of driving cars at higher speeds nearly halved the economic benefits, while simultaneously increasing fatal crashes by 24%.
What Are the Risks Associated With Increased Speed?
In addition, the American Journal of Public Health, one of the most highly cited journals on public health, found a “3.2% increase in road fatalities attributable to the raised speed limits on all road types in the United States.” According to the study, “the highest increases were on rural interstates (9.1%) and urban interstates (4.0%).” In short, our highways will be less safe.
Do Higher Speed Limits Cause More Accidents?
Yes.
Supporters say cars are safer than ever, and speed limits should reflect this. However, the laws of physics haven’t changed.
Once you reach about 56 mph, your chances of surviving a crash without serious injury plummet. According to Dr. David Harkey, President of the Insurance Institute for Highway Safety (IIHS), “Higher speed limits cancel out the benefits of vehicle safety improvements like airbags and improved structural designs.”
What Is the Relationship Between the Speed Limit and Accidents?
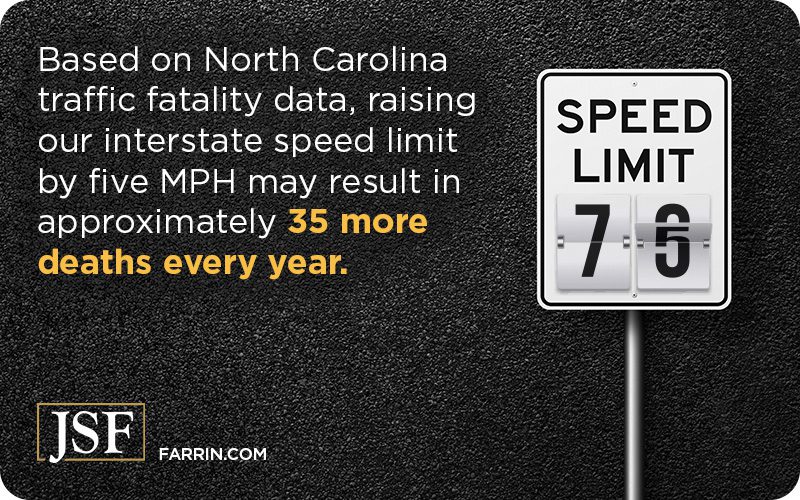
According to the IIHS, increasing the speed limit on an interstate by just five MPH leads to an 8% increase in interstate deaths. Speed limit increases have resulted in almost 37,000 extra deaths in the past 25 years. Based on North Carolina traffic fatality data, raising our interstate speed limit by five MPH will result in approximately 35 more deaths every year.
Raising Speed Limits Will Increase Fatalities in Already Problematic Areas
Raising the speed limit will not have an equal effect on highways statewide and will exacerbate existing problems in areas of the state already dealing with high crash fatality rates.
For instance, Robeson County is one of the most dangerous counties for drivers according to the NCDOT. In 2021, Robeson had 63 fatal crashes and 1,208 non-fatal injury crashes. Raising speed limits in more rural areas will encourage speeders to push the boundaries even further. And for more congested regions, like Mecklenburg County, raising speed limits makes even less safety sense.
History repeating itself?
Sadly, we’ve been here before. In 1995, the NHS Act allowed states to set their own speed limits. Data from the National Highway Traffic Safety Administration shows that states which increased their speed limits in 1996 experienced approximately 350 more interstate fatalities, or 9% more than would have been expected.
The following year, North Carolina increased its interstate speed limit from 60 to 70 MPH and saw a 5.4% increase in interstate deaths, with interstate deaths accounting for 2.2% more traffic deaths overall than the previous year.
Is a jump from 70 to 75 MPH worth the extra deaths this time?
More people will die on our highways if we raise the speed limit in North Carolina, and, in my opinion, the purported benefits do not justify the risk to people. For the safety of North Carolinians, legislation allowing speed limits to be raised in our state must not be passed.
You’ve probably heard or read countless reports about rising inflation. From an economic standpoint, it means that money is worth a bit less. People adjust. Maybe you stop eating at restaurants, buy store-brand groceries, or trim a little off your insurance coverage to save a few dollars.
But what if I told you that insurance coverage, especially the minimum requirement, is already dangerously low and probably has been for a while?
This danger has been lurking and growing in the background. And, to my eyes, it’s getting to the point where some people who are very much in need will find themselves in extremely dire circumstances.
Inflation, Insurance Minimums, and an Injured Accident Victim
I’ve researched costs, general inflation, medical cost inflation, and insurance coverage requirements. Individually, each of these individual trends is a bit alarming. When you put them together, I think you’ll find a disaster in the making for car accident injury victims.
Let’s say you’re hurt in a car accident in the Carolinas. The person at fault for hitting and injuring you has the minimum required insurance and nothing else. In other words, that insurance alone is what’s going to pay for your harms and losses.
Or will it? What can you expect, and what should minimums really be according to the math? We need data points to determine inflation’s effects on car accident injury victims. We need to know:
The effect of general inflation over time – how much have costs increased or the value of money decreased?
The effect of medical inflation over time – how much more expensive has medical care become?
Car accident costs – how much does medical care cost, and what has happened to automobile costs?
The minimum insurance coverage amounts – who is covered and for how much in a minimum liability policy?
Finding uniform statistical data is difficult due to different methodologies, sources, and even formulas. I want to illustrate and identify a trend, and then evaluate what we have versus what we need. The following data comes from different sources, but I’ve tried to keep things apples-to-apples for consistency.
Economic Inflation and Car Accident Injury Trends
Inflation is defined as a general increase in prices and a fall in money’s purchasing value. Most people understand it that way, but how it’s quantified can vary. For example, the Bureau of Labor and Statistics observes and calculates inflation with the Consumer Price Index (CPI) while the Federal Reserve uses a different method. The CPI offers a snapshot of prices and monetary value at a specific time, so we’ll use it.
Inflation defined: A general increase in prices and fall in the purchasing value of money.
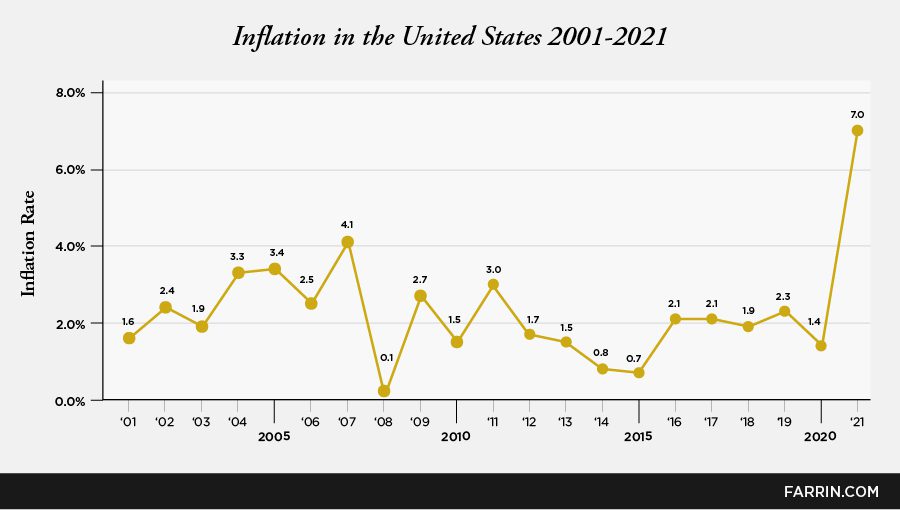
I’m not going to dive too deeply here, but to unravel this minimum insurance problem, we must appreciate the fundamentals of inflation. The following chart illustrates inflation trends via the CPI. It’s important to note that the net result is cumulative, compounding the effect. For example, if something cost $1,000 last year, and inflation increased by 5% this year, it would cost $1,050 ($1,000 + 5%). If inflation again increased by 5% next year, the same item would cost $1,102.25 ($1,050 + 5%).
The graph shows dips and valleys because it charts the CPI, which represents the percentage increase in inflation year over year, not actual prices which have steadily increased. For example, in 2008 when the CPI is 0.1 ( the lowest point on the graph), prices still increased over the prior year.
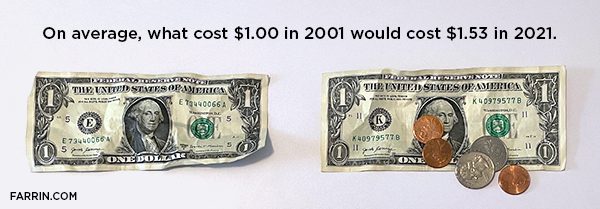
If you just add the inflation percentages, you get 48%. However, the cumulative effect due to compounding is a more significant increase. To give you another example (with possibly a different methodology), according to usinflationcalculator.com, an item that cost $1.00 in 2001 would see a cumulative increase in price due to inflation. In 2021, the inflation-adjusted price would be $1.53.
Based on the data, let’s just round it off and say that since 2001, overall prices have reportedly increased slightly more than 50% – a conservative estimate by some measures. So what does that mean for you after an accident?
Suppose another driver hits and injures you. The economic damages – which we’re treating separately from medical costs – generally include damage to property, lost wages, and other non-medical expenses like a rental car.
The first (and possibly largest) non-medical economic burden on an accident victim will likely be their vehicle. You had a car that was either damaged or destroyed (totaled) due to another driver’s negligence. What does that cost you, and how has that cost changed over time? Let’s take a look at how car prices have changed over the years.
Inflation and the Cost of Replacing Your Car
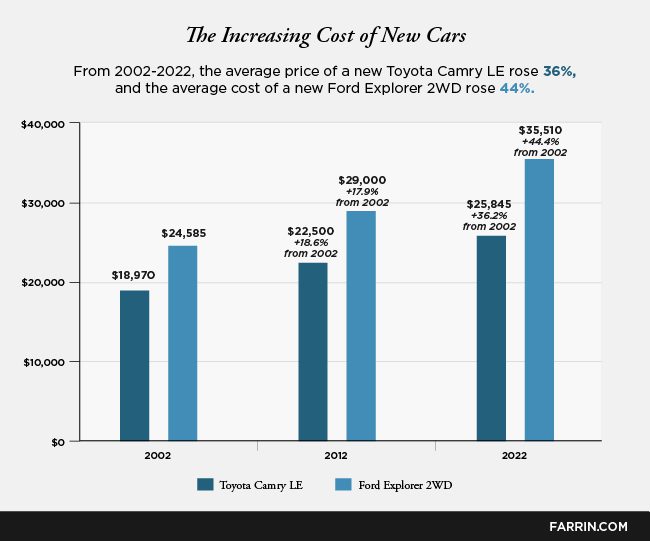
To get a real-world idea of the change in car prices, let’s compare the price of a new Toyota Camry and a new Ford Explorer – two of the most common and best-selling vehicles in their classes. Trim levels change over time, but we’re trying our best to compare apples to apples here.
These numbers reflect the manufacturer suggested retail price (MSRP) of the same model without lots of features. It’s worth noting that many buyers “option their cars up,” and the cost increases. Of course, not everyone buys a new car; after an accident, some will look for a vehicle on the used car market. How have those prices changed?
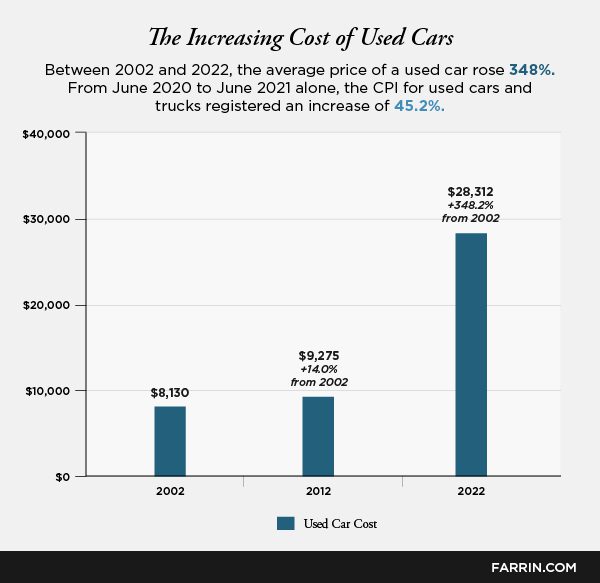
Used car prices are much more chaotic and tricky to judge as they span all models and multiple years of vehicles. A 2010 model used car will generally cost far less than a 2020 model used car. Take these numbers with a grain of salt, but understand that these are averages: they represent many buyers.
It does not help that the scarcity of new vehicles due to semiconductor shortages and supply chain issues caused by the pandemic has made used cars a more desirable commodity. If you’re in a crash, replacing your vehicle could be far more expensive than you imagine.
And the minimum required insurance of the at-fault driver may not cover it.
Inflation and Wages
To put the economics in perspective, we need some context – specifically, we need to know how much money the average person makes to compare it with the costs above. It is a broad generalization, of course, but we want to identify a trend, not cherry-pick here.
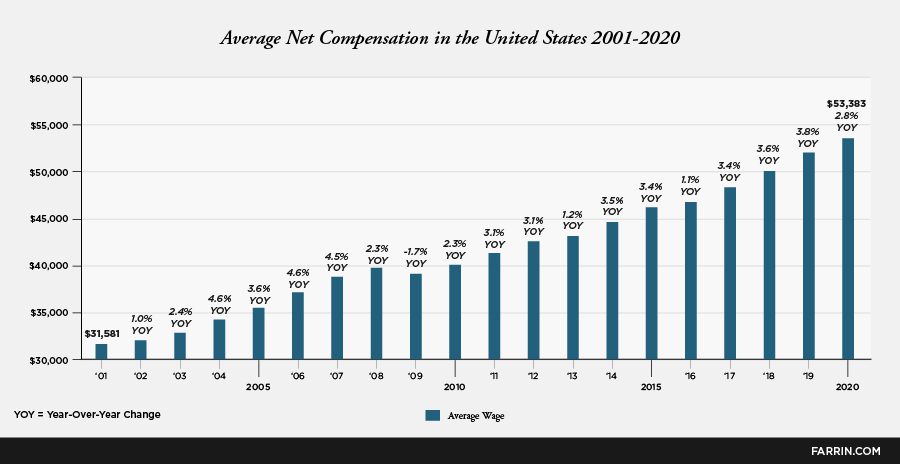
The Social Security Administration keeps a living record of average and median wages called the Average Wage Index (AWI). Since 2001, the numbers look like this.
From 2001 to 2020, the average net compensation in the U.S. rose by about 69%. However, recent, rapid rises in inflation (like 2021’s 7% hike) threaten to outpace wages significantly. Also, these numbers are raw – inflation each year made the money worth just a bit less!
Medical Cost Inflation and Car Accident Injury Victims
As an attorney, I can tell you that every injury case is unique. Different people, circumstances, injuries, and so on. One overwhelming similarity, however, is the meteoric rise of medical costs. There are many other statistical measures and ways to express the change in cost over time – all different but similarly alarming.
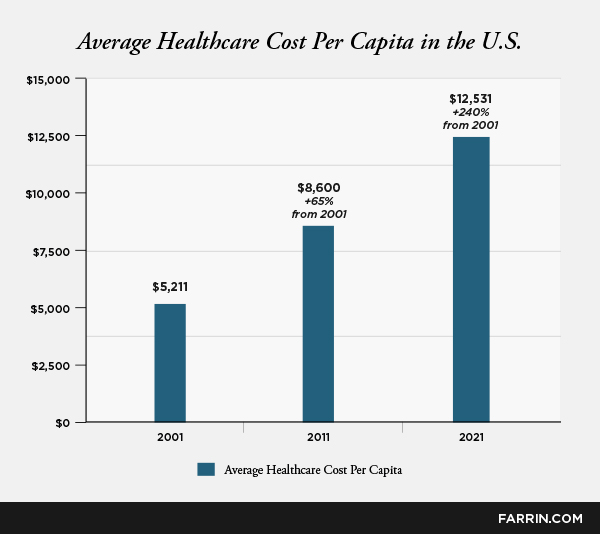
The following statistics are all from the same data source to keep the numbers consistent in relation to each other. We can begin with a disturbing look at the cost per capita.
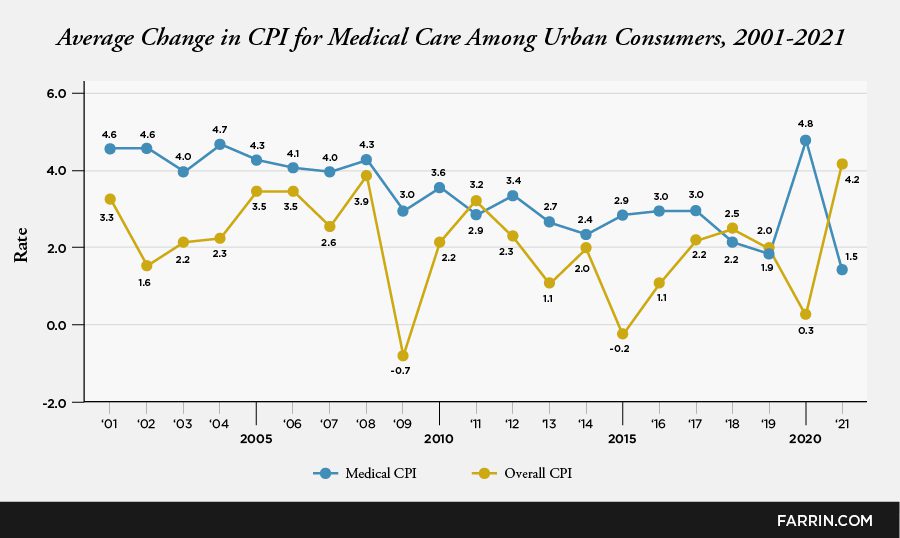
Medical and healthcare cost inflation has been a simmering problem for quite a while. The average change in the Consumer Price Index (CPI) for medical care for urban consumers illustrates a steady rise that has outpaced the rate of increase for all goods and services.
According to the raw data, medical care prices – including services, drugs, medical equipment, and insurance – have grown 109.2% since 2000. In that same time, prices for all consumer goods have increased by 68.8% (again, different sources and methods produce different numbers). The data isn’t necessarily perfect – our aging population will drive the average cost higher, but how can it possibly account for such a dramatic increase?
The long and short of it is that costs are rising, prices can be nonsensical, and they’ve outpaced general inflation for a long time. One thing that hasn’t increased much or often? Minimum insurance requirements.
Minimum Insurance Requirements and Car Accident Victims
Believe it or not, we attorneys like insurance. We may disagree with how the insurance company calculates its offer, what constitutes a fair offer, and why it denies coverage (and how some of them treat our clients sometimes), but, by and large, insurance coverage is what pays to make our clients whole.
Automobile insurance is required in most states, including North and South Carolina. The states set their own rules, including the mandatory minimum liability coverage. Many states wrote their requirements into law in the 50s, 60s, and 70s. Some states have not sufficiently increased those minimum requirements to keep pace with costs.
Liability coverage defined: An insurance product that protects an insured party against claims resulting from injuries and damage to other people or property.
Note that optional coverages, such as comprehensive, collision, and “MedPay,” can be added to your policy to pay for the damages you suffer in an accident that’s your fault or damage resulting from other things, like hail storms. Most states also require drivers to carry uninsured/underinsured motorist coverage (see below).
Minimum Insurance in South Carolina, Then and Now
In South Carolina, the required minimum insurance policy was once only $10,000 for injury to or death of one person, $20,000 for injury to or death of two or more persons, and $5,000 for injury to or destruction of property.
Thankfully, South Carolina has raised those minimums, which are currently:
$25,000 for bodily injury to any one person,
$50,000 for bodily injury to two or more persons, and
$25,000 for injury to or destruction of property of others in any one accident
Minimum Insurance in North Carolina, Then and Now
North Carolina has required drivers to carry insurance since January of 1958. In those early days, the requirements – which were defined differently – required $5,000 for the bodily injury or death of one person, $10,000 for the bodily injury or death of two or more people, and $5,000 for the injury to or destruction of the property of others.
Those numbers have risen significantly, thankfully, as North Carolina now requires:
$30,000 in coverage for bodily injury or death to one person,
$60,000 for bodily injury or death to two or more persons, and
$25,000 for the injury to or destruction of the property of others in any one accident
Unfortunately, you’ll see below how that may not be nearly enough compensation to cover the average victim’s harms and losses.
Across the Country: Some States Are Starting to Adjust, Some Aren’t
Governments aren’t blind to the effects of inflation, though they may be slow to respond. Here are a few states and their changes over the last five years. The numbers below are expressed as:
per-accident bodily injury liability for one person/
bodily injury liability for two or more people/
property damage coverage
in thousands of dollars:
Delaware: On December 13, 2017, the minimum liability limits increased from 15/30/10 to 25/50/10.
Connecticut: On January 1, 2018, the minimum liability limits increased from 20/40/10 to 25/50/25.
Kentucky: On January 1, 2018, the minimum property damage liability limit increased from $10,000 to $25,000.
Indiana: On July 1, 2018, the minimum property damage liability limit increased from $10,000 to $25,000.
Nevada: On July 1, 2018, the minimum liability limits increased from 15/30/10 to 25/50/20.
Other states remain stubborn. California’s minimum requirement for bodily injury to one person is just $15,000 (and property damage is just $5,000) in one of the country’s most expensive states. In Florida, the minimum coverage is $10,000 each for property and bodily injury. New Hampshire and Virginia don’t even require a driver to purchase auto insurance. While some states are adjusting, drivers in many parts of the country have reason to be concerned with insurance minimums.
The Rising Costs of Accidents: Are the Minimums Enough?
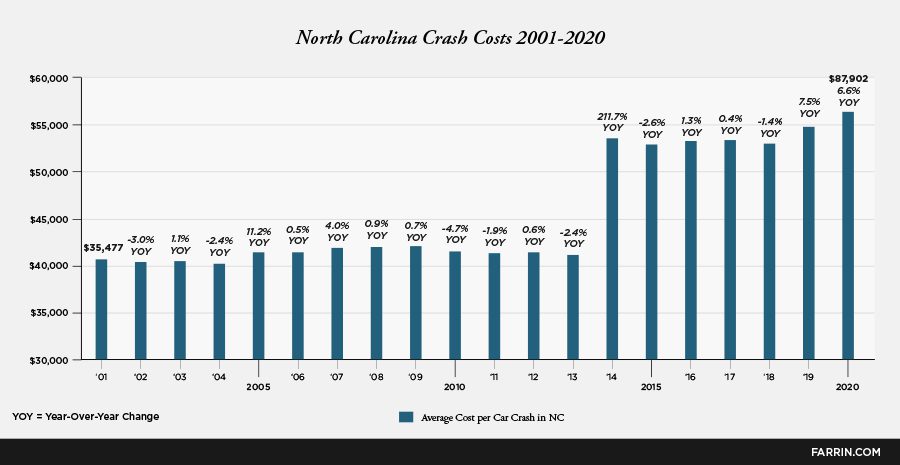
Data from the Carolinas can bring all of this closer to home. North Carolina tracks total cost per crash, expressing it as a three-year average. We can plot this data to give an idea of the actual cost of an average crash over time. The numbers from the chart below include all crash types.
The National Safety Council (NSC) publishes a guide to calculating the economic cost of motor vehicle accidents. Note that this is not the same thing as “damages.” The NSC accounts for costs including wage and productivity losses, medical expenses, administrative expenses, motor-vehicle damage, and employers’ uninsured costs.
The formula applies to individuals who have “no injury observed,” “possible” injury, “evident” injury, “disabling” injury, and death.
Average Economic Cost by Injury Severity
Death
$1,750,000
Disabling Injury
$101,000
Evident Injury
$29,200
Possible Injury
$23,900
No injury observed
$12,800
Obviously, crashes with fatalities have the highest cost. There are far more injury crashes than there are fatal crashes.
The takeaway is that the average cost of an accident – especially with an injury and doubly so for a severe one – is either dangerously close to minimum policy limits at best, or vastly beyond it at worst.
What About Uninsured/Underinsured Motorist (UM/UIM) Coverage?
North Carolina requires all insurance policies to include uninsured/underinsured motorist coverage. This may seem counterintuitive since the state requires that every driver have insurance. It is necessary, though, because the at-fault driver may not have enough (or any) coverage.
The minimum requirements for these extra insurances will seem familiar in North Carolina and South Carolina. They generally mirror the minimum insurance requirements for liability coverage. Essentially, regardless of your chosen coverage, your policy likely includes a minimum liability policy in case other drivers are uninsured. These UM/UIM policies help many accident injury victims and are sadly necessary.
However, while the presence of these policies is undoubtedly a good thing, they suffer the same flaw as a policy with the minimum requirements: it’s just not enough now in many instances. Remember that these UM/UIM policies are safety nets. They’re not supposed to be needed very often.
Putting It All Together: Minimum Insurance Is (Probably) Not Enough Insurance
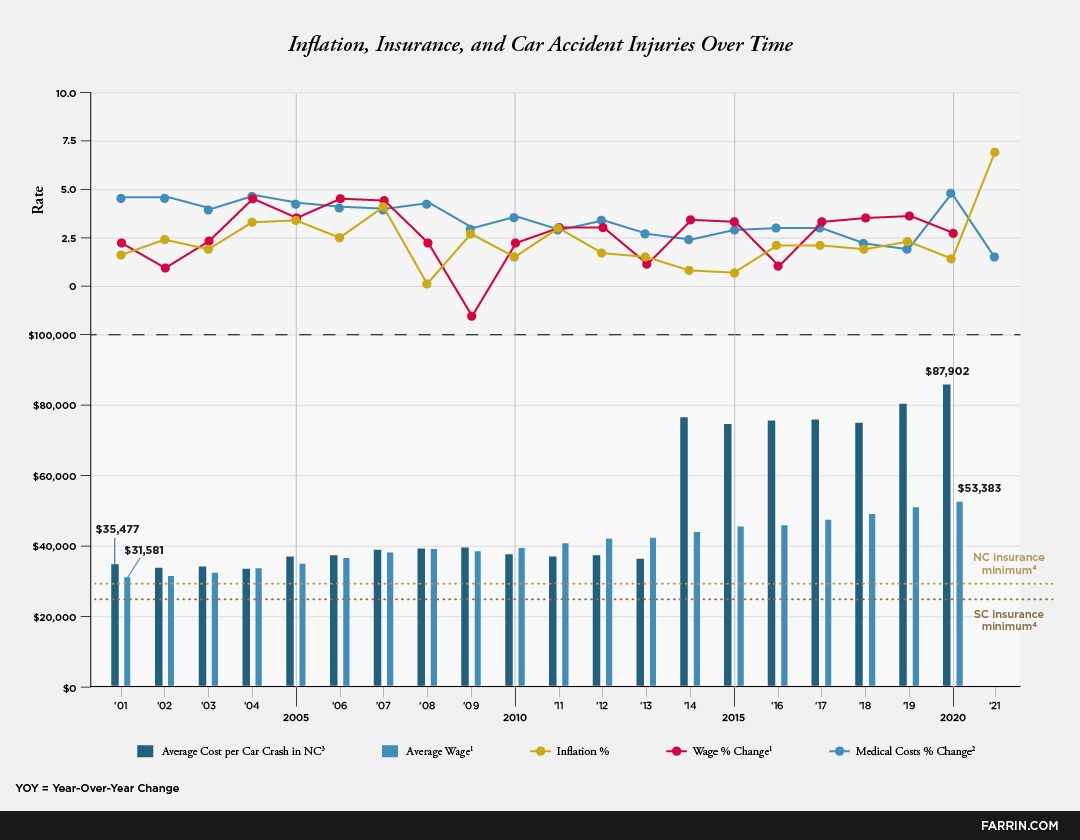
When you assemble the economic inflation, medical cost increases, wages, average cost of an accident, and so on, you reveal something frightening: the minimum insurance requirements may not come close to covering the expenses for someone injured in a crash.
1 From the Social Security Administration’s Average Wage Index 2 From KFF analysis of CPO data from the Bureau of Labor and Statistics 3 Calculated as year-to-year increases from the NCDOT’s annual Crash Facts publications; these numbers include property damage, are expressed as three-year averages, and are calculated using inflation-adjusted dollars. 4 These numbers reflect the state-mandated minimum bodily injury coverages for one person in a crash.
There are several key takeaways from this big picture:
The recent sharp rise in inflation, in general, will change consumer behavior. Insurance premiums are already rising – reflecting the cost of vehicles, the scarcity of parts, and the increasing difficulty in parts supply. Some of the data has not caught up – but will. Note especially the disparity between wage increase and the recent spike in inflation. Some people may reduce their insurance coverage to lower their premiums.
Medical costs have outpaced inflation and wages significantly. What everyone has been thinking is true. Medical and healthcare costs, in general, have grown considerably faster than inflation, and the data has not yet even taken the recent historic inflation spike into account.
While most accidents do not involve severe or disabling injuries, the minimum required coverage is too low for many victims. Suppose you have the minimum coverage and are at fault in the “average” injury accident in North Carolina. In that case, your coverage could be far less than is needed to make an injured person whole. Now imagine that injured person is you!
According to the trends, the minimum liability insurance should increase. How much it should increase by state is a matter of debate. One would hope the minimums could cover the average accident cost.
What to Do About Insurance, Inflation, and Their Effect on Injury Victims
This data is alarming, so think carefully before reducing your insurance coverage to save a few dollars. Shop around. Consider all your alternatives before you make a move. If you already have just the minimum coverage, find out what it would cost to have a bit more bodily injury coverage.
Above all, drive with purpose. Be present behind the wheel and drive safely. None of this has to matter if you’re never in an accident. And if you ever are, you may be very glad you had more than the minimum required insurance.
As we gear up for Thanksgiving and the year-end holiday travel season, our Durham car accident lawyers want to take a time-out to urge you and your loved ones to make safety a top priority.
Although we often hear about the awful wrecks that occur on our highways, a study by AAA Carolinas indicates that more traffic deaths in North Carolina occur on rural roads. Although rural roads accounted for a low amount of the vehicle miles traveled, they accounted for an outsized portion of the state’s traffic fatalities.
And a recent report by NPR indicated that of the nation’s approximately 37,250 annual traffic fatalities, nearly 60 percent occur on rural roads. In some states, more than 90 percent of car accident related deaths occur on rural roads. In fact, the National Highway Traffic Safety Administration reports that drivers on rural roads die at a rate of 2.5 times higher per mile they travel than those on urban highways. In other words, those who travel in urban areas drive twice as many miles but suffer about half the number of fatal accidents.
Why is this?
For one thing, rural roads tend to be narrower. They may have lower shoulders, more curves, faded or non-existent road markers and street lights and far fewer police officers patrolling. This means people may be more likely to speed or take these routes if they are intoxicated – putting you and your family at risk.
The most dangerous rural road in the country has been identified as a stretch of lone highway in Utah. In the last 10 years, there have reportedly been more than 520 fatal accidents on that road. Of those, NPR reported:
117 were at night;
280 were during the day;
260 were in clear weather conditions;
84 were in poor weather conditions;
9 involved crashes with animals;
32 cases involved a DUI;
46 involved driver fatigue;
145 involved speeding;
288 involved driving off the road.
In North Carolina, 1,658 people were killed in crashes in 2020. This was nearly a 13% increase from 2019. For Thanksgiving 2020, there were more than 2,700 crashes, resulting in more than 1100 injuries. That’s just one five-day period. And while the overall number of crashes was down from 2019, fatalities were up.
As you might expect, alcohol factored into some of these crashes. For Thanksgiving 2020, 17% of fatalities were alcohol-related. Fortunately, over the past five Thanksgivings, 17% is the lowest reported number of alcohol-related deaths. 35% of fatalities from crashes were alcohol-related in 2018.
Christmas 2020 saw a whopping 2,828 crashes across the state. Nearly 1,200 people were injured in these traffic accidents. The worst year over the past five for Christmas injuries was 2018, with 1,408. Christmas 2018 also saw the most crashes, with Christmas 2020 coming in second.
New Years driving, covering a short period from December 31, 2019 through January 1, 2020, resulted in 702 crashes across North Carolina. Nearly half of those had associated injuries and fatalities. New Years 2020 was the worst one for crashes since 2016. As with the other holidays, unbelted drivers and passengers made up most of the crash fatalities (86%).
So wherever your travel takes you this year, please use extreme caution. First and foremost, wear a seatbelt. 65% of traffic fatalities on Thanksgiving 2020 involved unbelted drivers and passengers.
St. Patrick’s Day Among Deadliest for Alcohol-Related Crashes
While St. Patrick’s Day parades have offered fun and entertainment for all ages in year’s past, it’s a day of binge drinking for many. According to Wallethub, 75% of fatal drunk driving car crashes on St. Patrick’s Day involve a driver who has consumed more than 2X the legal alcohol limit. The legal limit in NC is 0.08.
St. Patrick’s Day is among the deadliest for alcohol-related crashes.
A National Highway Transportation Safety Administration (NHTSA) study found that alcohol-related crashes claimed a life every 51 minutes on St. Patrick’s Day in 2010, accounting for 32% of all fatalities that occurred that day.
NC Sober Ride Services Take You and Your Car Home
We don’t want to rain on anyone’s St. Patrick’s Day parade. We just want you to be safe getting to and from them (or any other event).
If you plan to drink, don’t drive. If you plan to drive, don’t drink. Designate a driver.
There are many services across North Carolina that offer designated rides home, and their rates are comparable to taxis, even cheaper in some cases. Whatever the cost, it’s cheaper than a DWI or worse – hospital bills and a lawsuit.
Here’s a list of North Carolina’s sober ride services in Charlotte, Raleigh, Greensboro, Winston-Salem, High Point, and Fayetteville and their surrounding communities and towns.
These services take you and your car home.
There’s also Uber and Lyft in addition to local taxi services. Not only can they take you home, but you could take them to the parade and avoid any parking issues – or having to deal with other drivers who may have had one too many Guinness.
Get FREE Advice From NC Car Wreck Attorneys
Whatever you do and no matter where you are in North Carolina during St. Patrick’s Day, we hope this information is helpful in your efforts to safely celebrate it. If you or someone you love was injured in a car wreck, whether or not it involved a drunk driver, contact an experienced car wreck lawyer.
AAA Carolinas released its annual report of the most dangerous roads in North Carolina, and it found that rural counties had the most fatal crashes, calling those places “killing grounds” for automobile accidents.
The annual report is based on a comparison of miles driven and the number of deadly North Carolina car accidents that occur. The report also provides results for the types of vehicles driven, including motorcycles and tractor trailers.
Clay County was determined to be the most dangerous for fatal crashes. Rounding out the top five were Graham, Hyde, Robeson and Hertford counties.
Those five counties accounted for 5.4 percent of the state’s total fatal crashes, yet only accounted for 2 percent of the miles driven in the state.
Drivers in Graham County were determined to have the highest risk of being in an injurious crash. Rounding out the top five were New Hanover, Pitt, Wayne and Cumberland counties.
“Rural counties have roads that are generally narrower, with more curves, lower shoulders, faded or nonexistent road markings and less police presence than major highways,” said David E. Parsons, president and CEO of AAA Carolinas. “These roads are notorious for single-vehicle accidents involving speeding, drinking and younger drivers.”
Officials with the N.C. Highway Patrol said they were trying to increase patrols in areas known to be problematic and were working with the N.C. Department of Transportation to improve roads and lower speed limits in those areas.
This is the third straight year that rural counties have topped the list for having the most dangerous roads. However, the news was not all bad for rural counties: Some also topped the list for safest counties.
Swain County was determined to be the safest for total number of crashes and number of injurious crashes, and Yancey County was considered safest for fatal crashes.
North Carolina Personal Injury Lawyers
If you or someone you love has been injured in an automobile accident, you may be entitled to compensation for your injuries. Contact the Law Offices of James Scott Farrin at 1-866-900-7078 for a free evaluation of your case and to find out if one of our North Carolina personal injury lawyers may be able to help you!


 Although we often hear about the awful wrecks that occur on our highways, a study by AAA Carolinas indicates that more traffic deaths in North Carolina occur on rural roads. Although rural roads accounted for a low amount of the vehicle miles traveled, they accounted for an outsized portion of the state’s traffic fatalities.
 The annual report is based on a comparison of miles driven and the number of