
We’re all too familiar with the narrative of 2020. A global pandemic, lockdown orders, and social distancing. And yet, in a time when a great many people were working remotely – if at all – the roads were arguably more dangerous, despite fewer vehicles being on the road. The National Safety Council (NSC) reported in March that traffic deaths in 2020 totaled 42,060 people, an 8% increase from 2019 and the first rise in the rate in four years.
How can that happen? We saw the numbers for North Carolina, and it made us wonder what could possibly be contributing to this phenomenon. What are the numbers, and what drove the sky-high fatality rates on roads that were far less congested than they had been in years? The numbers tell a story, but the story behind them may be even more shocking.
Part 1: Less Traffic, More Fatalities
– North Carolina Crashes
– North Carolina Injuries
– North Carolina Fatalities
Part 2: Government Response
– Law Enforcement
– Licensing Agencies
– Trucking Regulations
Part 3: Human Nature
– Driver Psychology
– Open Roads
– Seat Belt Use
– Driving Under the Influence
Part 4: Conclusions
Open Roads: Less Traffic, More Fatalities?
When stay-at-home orders came into effect in March 2020, the amount of traffic on roads worldwide dropped significantly. In a report from the North Carolina Department of Transportation, observed traffic for the period from March 2020 to October 2020 was down significantly from pre-COVID projections.
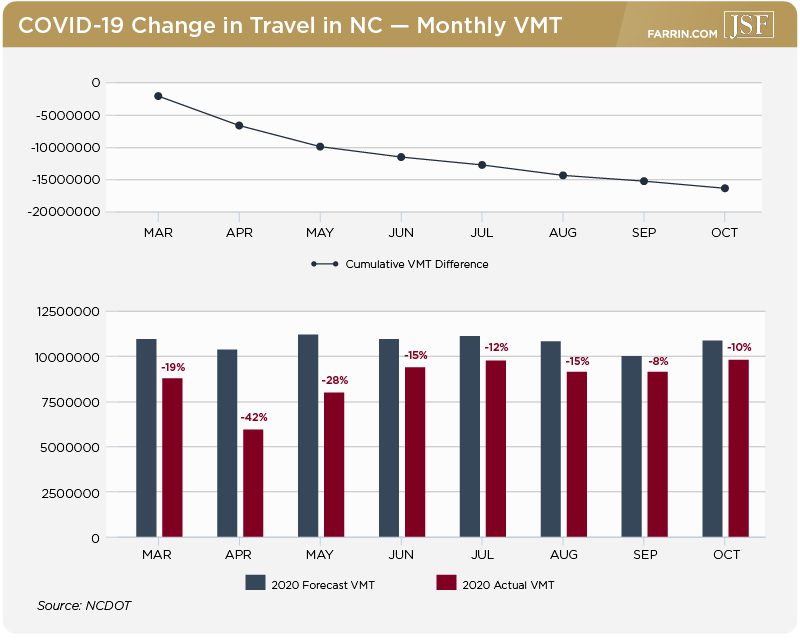
The graph shows a steady decline in overall traffic (actual miles traveled in red) versus what was projected (projected miles traveled in blue). In March, there were 19% fewer vehicle miles traveled than projected in North Carolina. In April, the deficit was 42%.
There were simply fewer cars on the road, and the trend wasn’t limited to North Carolina. The Federal Highway Administration (FHWA) compiles monthly reports of traffic volume on the roads that it regulates. For March and April of 2020, volume was down 18.6% in March and 39.8% in April versus the same time period in 2019.
So, traffic was down. Fewer cars were on the road. Logically, fewer cars on the road meant fewer car crashes. But, even with dramatically reduced traffic, traffic fatalities generally rose. While the NCDOT’s annual compilation of crash statistics for each year is published in the subsequent November, some statistics are already available, including the crash and injury totals.
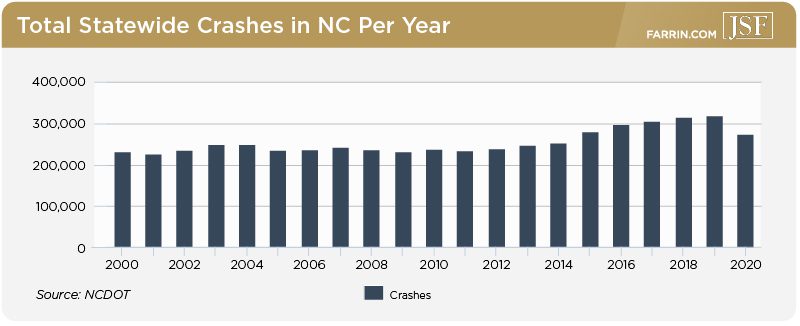
North Carolina Had Significantly Fewer Crashes in 2020
In North Carolina, the number of vehicle crashes for 2020 was 272,310, down more than 14% from 318,444 in 2019.
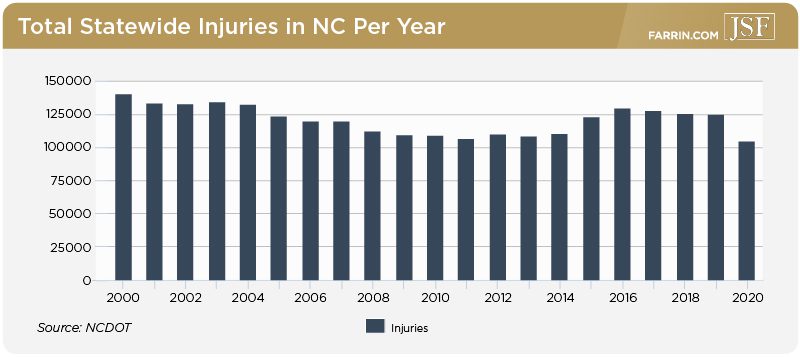
North Carolina Crashes with Injuries Decreased in 2020
Meanwhile, injuries resulting from crashes dropped dramatically to 104,967, down more than 16% from 125,434 in 2019. So far, so good.
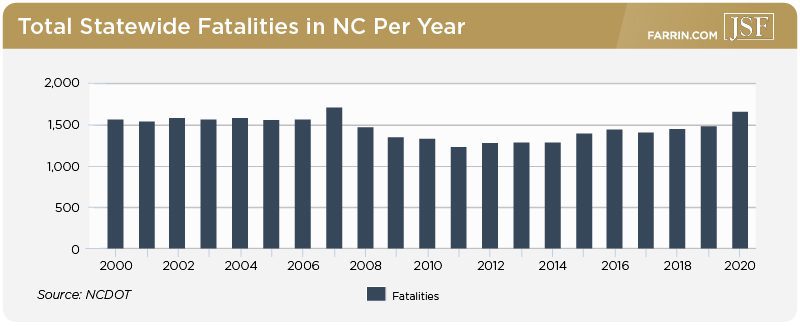
North Carolina Crash Fatalities in 2020 Highest in More Than a Decade
Unfortunately, that’s where the good news ends. While accidents and injuries were down year-over-year, fatalities sharply increased to 1,650 in 2020, an increase of more than 11% over 2019’s total of 1,479.
Comparing North Carolina to the Rest of the Country: Startling Trends
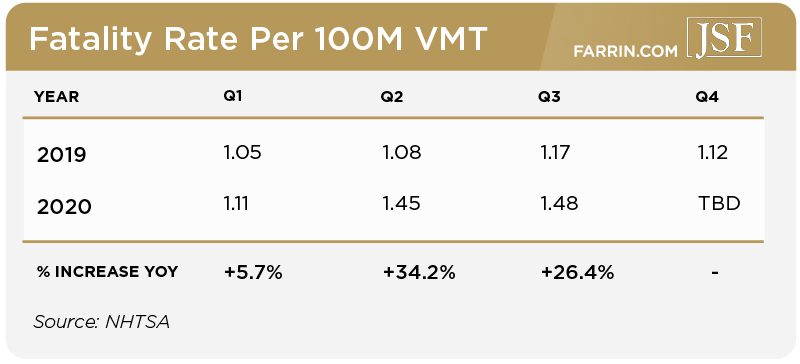
The statistic that may be most jarring of all is the rate of fatalities compared to vehicle miles traveled, which is usually expressed in millions. In North Carolina, the rate for 2020 was 1.52 fatalities per 100 million VMT. In 2019, that rate was 1.21. That means fatalities per 100 million VMT increased more than 25% in 2020.
That revelation led us to question what the national trend might be. Was North Carolina an outlier? Or was it indicative of a much broader crisis? The National Highway Traffic Safety Administration (NHTSA) compiles these stats by quarter, and gives a more complete view of the effect along with the context of when things really changed. With stay-at-home orders largely beginning in March – late Q1 – the change between COVID and non-COVID time is even more pronounced.
So, even though there were fewer cars on the road and fewer crashes overall, the rate at which people were being killed in those crashes increased profoundly. Why?
As is usually the case with such a widespread and dramatic statistical change – one that looks like an anomaly at a glance – there are many contributing factors. While some are speculative, the circumstantial evidence is convincing.
COVID Response Measures by Government Agencies
Hidden behind the stay-at-home orders, essential workers, and stimulus checks, the wheels of government were turning. A special report compiled by the NHTSA noted some decisions that likely played a significant role in the carnage to come.
Law Enforcement Agencies Deliberately Reduced Traffic Enforcement
According to the NHTSA’s analysis, through September of 2020, 65% of the first responders who died as a result of COVID were in law enforcement. In response to the risks posed to officers, law enforcement agencies responded with procedural changes.
“According to a survey released by the International Association of Chiefs of Police (Lum et al., 2020), more than half of the more than 1,000 responding agencies established policies explicitly reducing proactive enforcement including traffic enforcement, in both March and May 2020 when the survey was fielded, and nearly three-quarters had policies mandating the reduction in physical arrests for minor offenses.” –NHTSA Special Report: Examination of the Traffic Safety Environment During the Second Quarter of 2020
Meanwhile, NHTSA Regional Administrators were being informed by state law enforcement agencies about reduced enforcement of seat belt, impaired driving, and speeding laws. State entities were also investigating fewer crashes than normal. As noted previously, state data suggested that while the number of crashes investigated had dropped, the number of fatalities had increased in some places.
The key takeaway here is that the police were relaxing their criteria for traffic stops in order to reduce their contact with the public as a safety measure for both themselves and the communities they served. Offenses and risky driving behaviors that would normally result in someone being pulled over went unpunished.
Licensing Agencies Relaxed Rules and Suspended Testing Requirements
At the same time, many state agencies in charge of drivers’ licenses closed or drastically reduced their hours, and put emergency measures in place. According the American Association of Motor Vehicle Administrators, some of these measures included extending commercial licenses that were due to expire, reducing or eliminating road tests for new license applicants, and allowing novice drivers to receive full licenses without the requirement of a road test.
Drivers who may have needed to re-test, had their license limitations altered, or who simply had no quantifiable on-road experience were being set loose on roads with reduced enforcement measures in place.
Federal Trucking Regulations Were Relaxed
As the country began to lock down and supply shortages hit hospitals and supermarkets alike, the Federal Motor Carrier Safety Administration (FMCSA) issued an emergency declaration suspending many long-haul trucking regulations governing hours of service. Those regulations have been in place since the 1930s, and were aimed at keeping fatigued truckers off America’s roads.
The change was likely intended to enable the logistical networks and distributors across the country to operate at increased capacity when shortages were becoming alarmingly common. According to data published by the American Trucking Association in 2019, 71.4% of all freight travels over the road. Opening the taps, so to speak, by lifting regulation makes sense from that point of view.
While not every rule governing work hours for commercial truckers was rescinded by the declaration, it did eliminate a weekly hours rule and a mandate for 30-minute breaks, which allowed for continuing operation without rest. Fatigue was already noted as a factor in 13% of trucking crashes before the rules were suspended. It is also worth noting that, in France, deaths in the category of “professional drivers” did not decrease during the pandemic despite fewer road users.
And even if truckers on U.S. roads wanted to rest, they would have reduced opportunities to do so. Many rest areas, truck stops, and restaurants were closed due to COVID mandates. Combine these issues with apparently reduced enforcement and you have a recipe for dangerous roads.
Human Nature: Give Them an Inch…
There are certain behavioral trends that are easily predictable. The old saying, “Give them an inch and they’ll take a mile,” is a commentary on how people are prone to push boundaries. When existing rules are relaxed, people will push the envelope to find out how much they can get away with.
The NHTSA offers a theory regarding the psychology here, specifically about risk aversion. More risk-averse people are more likely to have reduced their driving and stayed home. Less risk-averse people were more likely to continue their routines and not reduce their trips. Less risk-averse people are, logically, more inclined to engage in risky behaviors like speeding or driving without a seat belt.
“In short, the stay-at-home orders may have led the population of drivers during the height of the health crisis to have been smaller but more willing to take risks.” –NHTSA Special Report: Examination of the Traffic Safety Environment During the Second Quarter of 2020
Driver Psychology
Psychologists have found that many drivers normalize low-level speeding. Drivers are also prone to be biased toward their own driving skills. Research gives us a great deal of warning as to what behaviors we can expect and from whom. Male and younger drivers are particularly prone to “optimism bias” toward their own driving skills, and younger drivers are more likely to speed.
Now, to compound, research also shows that drivers may determine how fast to drive by cues from the road or surroundings. For example, if general traffic is going 70mph in a 60mph zone, drivers may adjust their speeds to match their peers. In this way, speeding becomes, itself, epidemic.
Open Roads and the Need for Speed
As we noted in a blog from May 2020, enforcement agencies were already seeing a marked increase in speeding, sometimes to levels bordering on ridiculous. A few highlighted stories from those early days of the lockdown foreshadow the fatality statistics from the year:
- The Colorado State Patrol issued more citations for 20+ mph over and 40+ mph over the speed limit through March 2020 than it did in March 2019, despite reduced traffic volume.
- For the one-month period starting on March 19 when California’s stay-at-home order was put in place, the California Highway Patrol reports it issued 87% more citations for drivers exceeding 100mph than it did for the same period a year ago – 2,493 statewide versus 1,335 a year ago – despite a 35% reduction in traffic volume (or perhaps because of it).
- In New York, automated speed cameras issued 24,765 speeding tickets on March 27, almost twice as many as the daily average a month before despite there being fewer cars on the road.
The trend of speed continued through 2020, and the end-of-year accounting of traffic enforcement and statistical data bore fruit.
- In Minnesota, the number of drivers ticketed for going more than 100mph doubled in 2020. Traffic deaths increased 9% in 2020 – again, despite fewer miles being traveled.
- According to the Wisconsin Department of Transportation, 2020 fatalities involving reckless driving behaviors were at their highest levels during the lockdown (through the period they observed). Eight other Midwest states also reported increases in traffic fatalities through October 29th, 2020.
- Even after the initial lockdown, data indicates that increases in collisions between August and October 2020 outpaced the growth in travel in the top 25 metro areas in the U.S. That means that as more people rejoined the roads, accidents were happening at an even greater rate.
The NHTSA report summarizes what the data shows: “Reductions in roadway volumes and associated congestion result in higher average travel speeds and greater speed variability.”
Add to that, a study by the Insurance Institute for Highway Safety (IIHS) showed that even a nominal increase in speed reduces the ability of even modern cars to protect occupants. Crash tests are typically carried out at lower speeds than most U.S. Interstates allow.
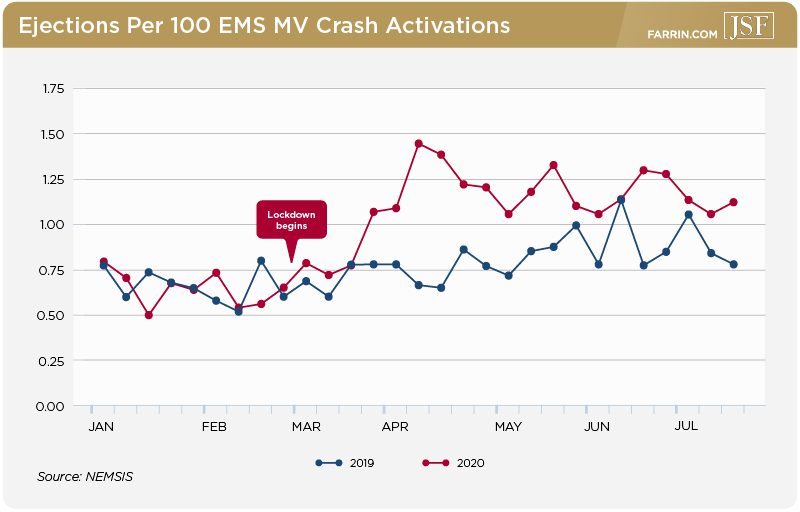
Drivers Unbuckled – More Crashes Resulting in Ejections
According to data from the NHTSA, and supporting its theory regarding less risk-averse drivers, there were increases in the instances of unbelted drivers being killed in accidents. For the period from January 1 – May 21, 2020, the state of Virginia recorded a 15.4% increase in the number of fatalities involving unrestrained motorists versus the same period in 2019. Minnesota also recorded an increase.
As a surrogate for disparate data from each state, the NHTSA uses ejection rate as a measure of unrestrained drivers and passengers in motor vehicles, as they are by far the most likely to suffer an ejection during a crash. Expressed in “ejections per 100 crashes,” the weeks following the lockdown saw significant increases over previous years.
More Drivers Were Likely Under the Influence
Continuing to support the NHTSA’s theory of the roads being populated with drivers who were less risk-averse, the data suggests that alcohol consumption overall increased during the lockdown. The World Health Organization (WHO) declared the coronavirus to be a global pandemic on March 11, 2020. By March 27, more than half of the U.S. population was subject to a stay-at-home order. Between the weeks of March 22 and March 29, 2020, alcohol sales skyrocketed.
According to a study by Mercato, for those weeks, online orders of liquor rose 204%, wine rose 200%, and beer rose 159%. The further into the lockdown we went, the more sales increased. For the week of May 17, 2020, liquor sales increased 1,244%. Beer sales grew by 636%.
Those numbers are surprising, but when put into the context, they paint a more dire picture. Less risk-averse drivers are more likely to engage in risky behaviors on the road, including driving under the influence. The NHTSA cites a study on drug prevalence among road users conducted September 2019 through July 2020, using March 17 as the fulcrum between pre- and post-COVID measures being in place. The study measured severely or fatally injured road users from five trauma centers.

While these statistics apply primarily to Q2 2020, they’re a significant insight into the kinds of drivers that tended to take to US roads during the pandemic, and the data correlates to the NHSTA’s theory of there being more drivers on the road who were less risk-averse.
Conclusions and What We Can Learn
The NHTSA has gathered and analyzed massive amounts of data – and the report we cited did not even cover the entirety of 2020. The agency was not, however, alone in its analysis. Other studies were performed. Data continues to be compiled, but the more we see, the clearer the picture becomes.
It was a perfect storm, in a manner of speaking. It’s plausible that the general anxiety over the pandemic distracted the more risk-averse people from more immediate threats, including those on the road. People who were less risk-averse, and did not appreciably alter their behaviors, were more likely to be on those roads more often and were more likely to engage in behaviors including impaired driving and not wearing their seat belts.
That’s a very plausible recipe for the increase in fatalities and fatality rates, and the circumstantial evidence is incredibly strong.
Hindsight, and How Planning Ahead Saves Lives
The lesson here could very well be that the world simply was not prepared for a pandemic. Governments across the globe, including the U.S., simply could not cope with the scope and speed of the virus. There were so many alterations in how different entities and agencies operated and responded through the crisis that it’s difficult to tell which dominoes fell when, and how many followed.
Overall, the failure to see past the immediate effects of response measures – which appeared in many cases to be reactionary rather than planned – almost certainly played a significant role. Reducing regulation and enforcement allowed for certain behaviors with the omission of consequence.
This experience has taught us all many things, about ourselves and how we interact with others. While data is still flowing on the real effects of the virus on traffic fatalities, it’s already clear that fatalities were unusually high for the low volume of traffic and accidents. We can only hope that we can apply what we’ve learned in response to future crises, and avoid triggering a similarly tragic year on the road.
You May Also Be Interested In
Answers to the Most Frequent and Urgent Car Accident Injury Questions
COVID-19 Reduces Traffic, Increases Speeding – and Risk
N.C. Police Target Aggressive Drivers in Ghost Cruisers
House Bill 158: Untested Teen Drivers Hit the Roads, and Parents May Be Liable for Their Accidents

